 I'm beginning to work on a project which I've been tossing around for the last few weeks, which involves visualizing and navigating through my field recordings. I've had an interest in field recording for the past few years, and have incorporated it into a few projects in the past: see Along the Karakoram, Xinjiang-Hunza compilation, Sound Transit, and Stone Barns recording.
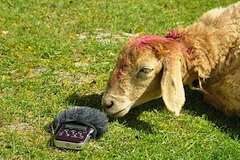
I am inclined towards field recording by interests in recollection and documentation through sound, i.e. "phonography", sound ecology (e.g. R. Murray Schafer, Hildegard Westerkamp), and sound art/musique concrète (e.g. Michel Chion, Chris Watson, Francisco López). Like the latter two, I am interested in sound design, finding complementary and contrasting sounds from the real world, and using them as a palette for composition. My recorder has collected samples from bazaars, alleys, malls, protests, temples, forests, elevator shafts, pig pens, and various other locations which occasionally draw funny looks from people or animals.
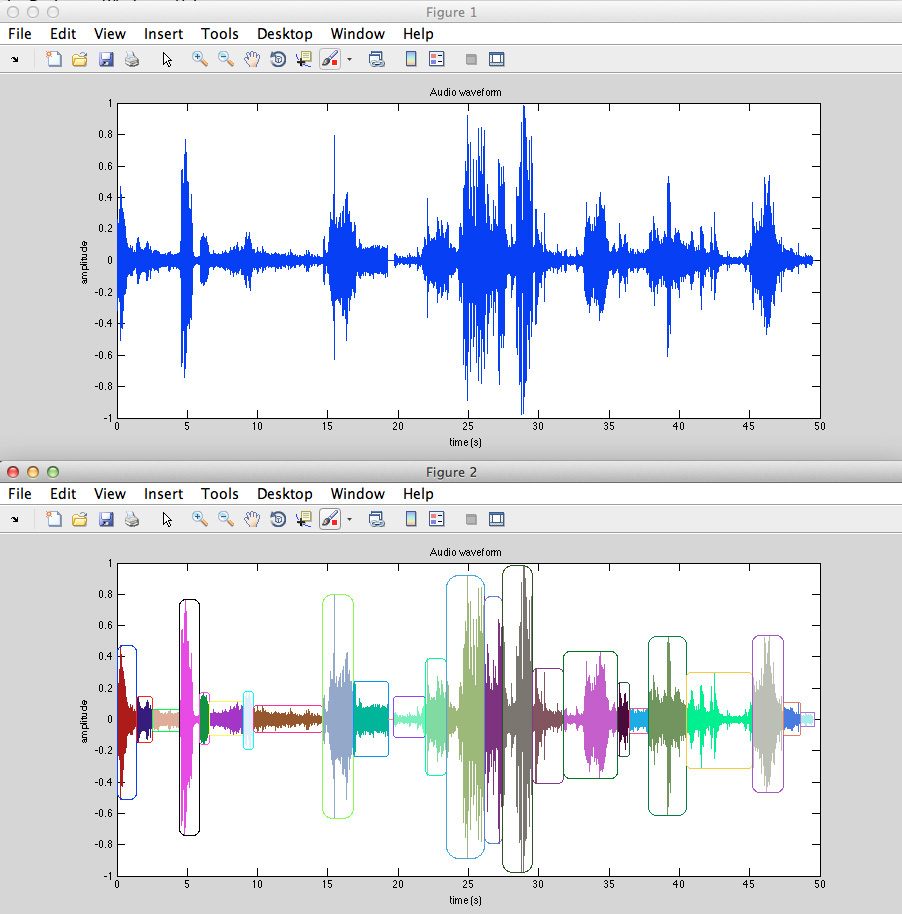
Because I compile many hours of recordings, I can gain some agility in managing my collection via audio processing techniques to help organize those sounds along various parameters of interest, and find clusters of similar sounds and complementary sound pairs. I am aided here by MIRtoolbox, a MATLAB-based library for music information retrieval, made by a group at the University of Jyväskylä in Finland. MIRtoolbox fluidly handles a number of common audio tasks. With it I automatically segmented the raw recordings into a collection of relatively self-contained sound events ranging from half a second to more than 10 seconds long. The segmentation algorithm attempts to optimally divide each recording to maximize the dissimilarity among all segment pairs, example shown below.
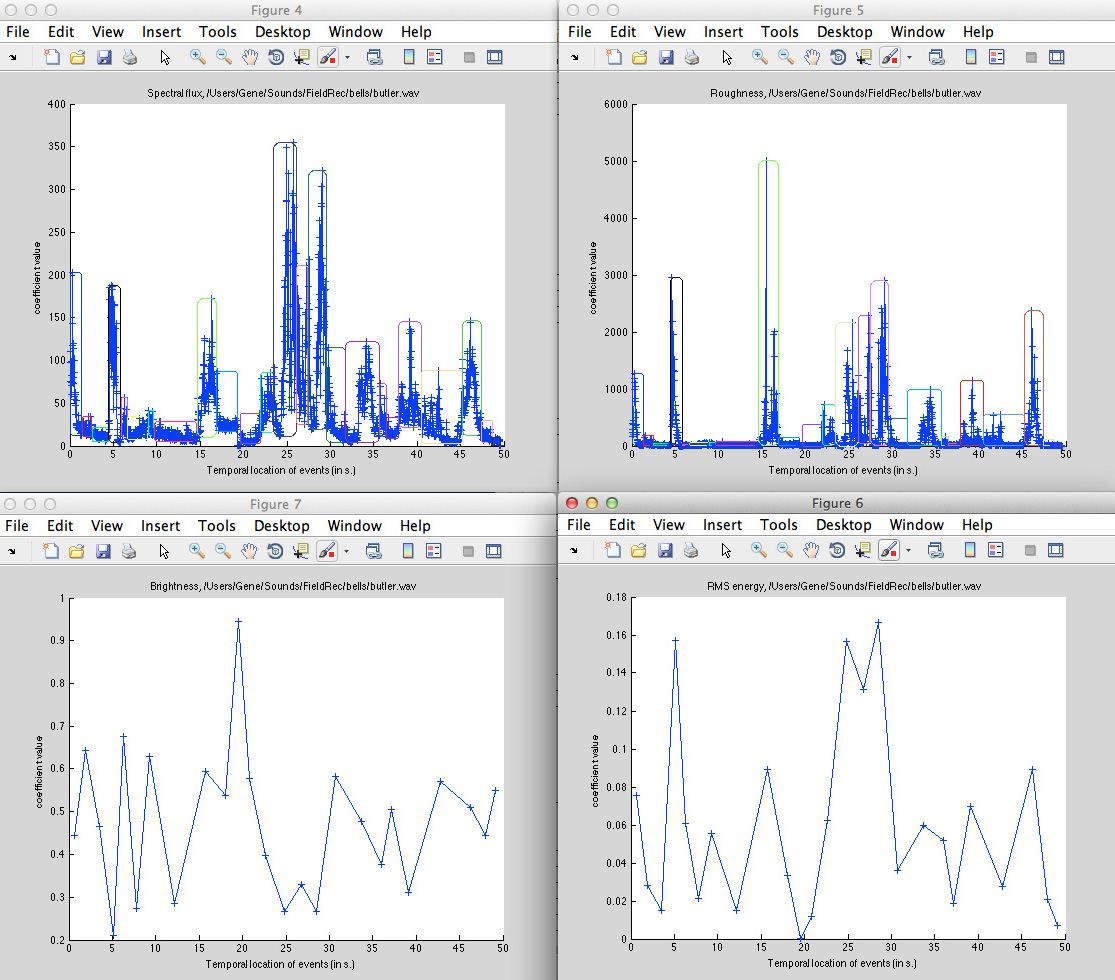
I then extract features from the segments, which are various quantities characterizing the dynamics and timbre of the sound, providing for a compact representation of each segment, with similar groups of sounds having relatively similar representations (ideally). Some of those features are shown below: spectral flux is a measure of the dispersion of the sound among all frequency bands (loosely related to the "noisiness" of the sound), roughness can be interpreted as a measure of dissonance in the signal, brightness is a measure of how much of the sound's energy is contained in frequencies above 1500 Hz, and RMS (root mean squared) energy corresponds to the average energy level, correlating to loudness.
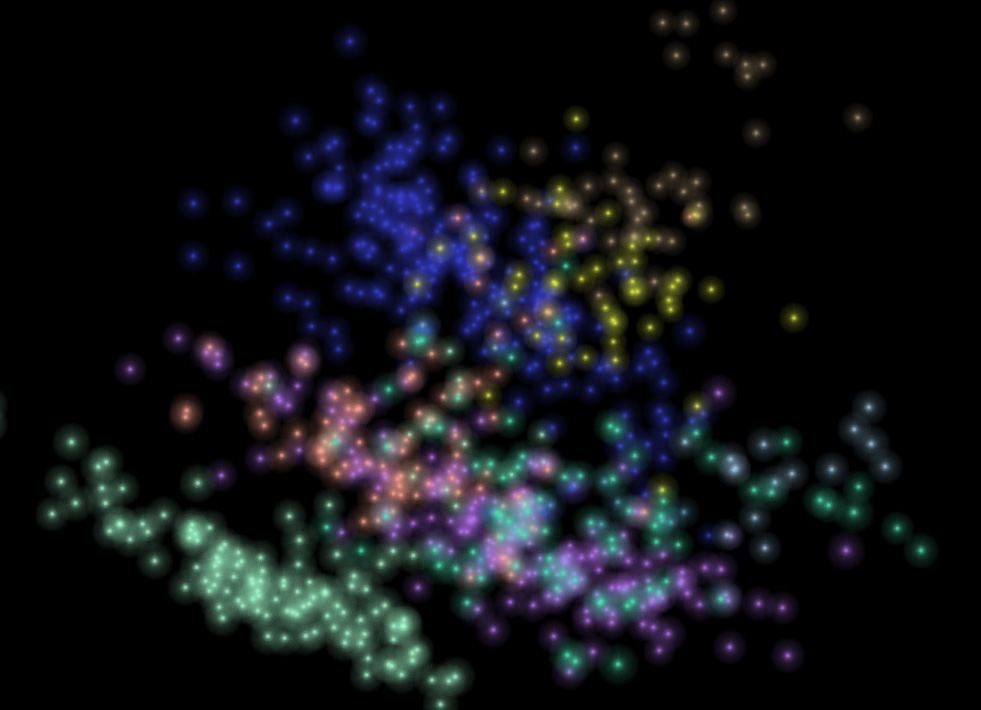
The resulting high-dimensional matrix describing all these segments is then finally reduced to a three-dimensional one via principal component analysis. I can then plot the audio segments in a three-dimensional view, as seen below. The colors refer to different source audio files, and not surprisingly, segments from within the same file tend to cluster together. But there is some overlap among sounds contained in different files, and its these pairs where I hope to find unexpectedly nice juxtapositions.
I'm using SuperCollider to handle the audio playback; meanwhile Processing runs the visual and interactive component, and communicates with SuperCollider via open sound control (OSC). My goal is to create a high-level interface that lets me effectively navigate through all this audio content, and slowly incorporate musical elements into it, building towards a sort of musical instrument with typical features like loops and filters. I will post more later when I am closer to having something of a demo.